
Accessing the Live View Feature
You can access the Live View feature by navigating to Analytics > Live View from the top menu.Transaction Summaries
The following figure shows the transaction summary region: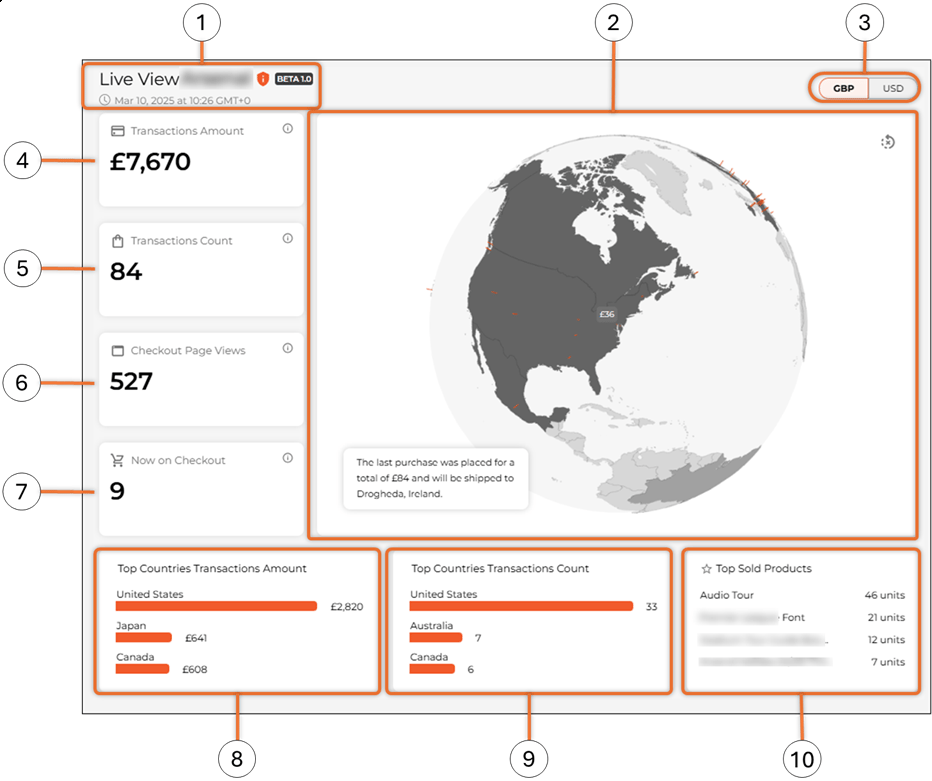
The Live View feature uses each country’s default time zone. For example, the default US time zone is New York.
| Element | Name | Description |
|---|---|---|
| 1 | Basic information | Merchant name, software version, and last automatic content update. Hovering over the red icon displays an important message explaining why Live View data may differ from other data reports. Hovering over the clock icon describes Live View’s information update rate. The timestamp to the right of the clock icon shows the timestamp of the last update. |
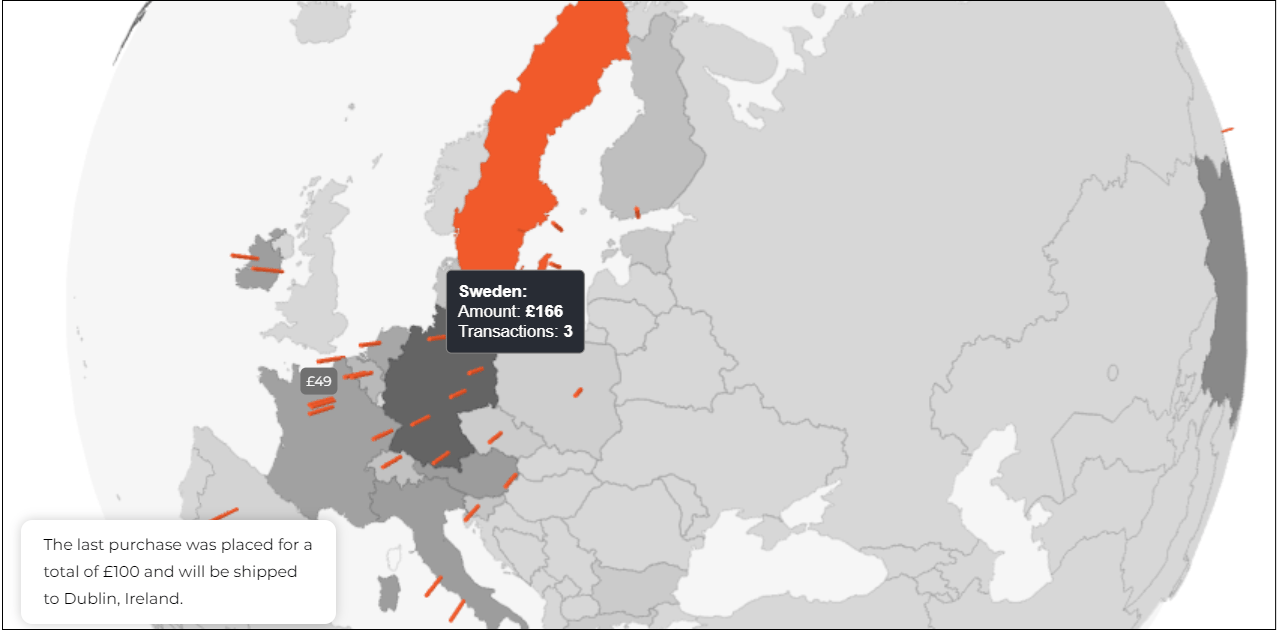
| 2 | Display | Hovering over a country shows its portion of the total transaction amount and count, as well as all cities in that country that purchases were made to.The globe visualization rotates continuously to the last purchase locations and can be paused by clicking the arrow in the top right corner of the panel. |
| 3 | Currency | Currency selector |
| 4 | Transactions Amount | The aggregated total amount paid at checkout by the customer since 12:00 am in the merchant’s local time zone. |
| 5 | Transactions Count | The number of transactions completed by customers since 12:00 am in the merchant’s local time zone. The transaction count does not include cancelled orders. |
| 6 | Checkout Page Views | The total number of times the Checkout page has been opened since 12:00 am in the merchant’s local time zone |
| 7 | Now on Checkout | The number of customers currently on the Checkout page |
| 8 | Top Countries Transactions Amount | The countries with the top three transaction amounts |
| 9 | Top Countries Transactions Count | The countries with the top three highest transaction counts |
| 10 | Top Sold Products | The four top sold products in terms of unit. Note that long product names are truncated, but can be seen by hovering over them. |
Transaction Graphs
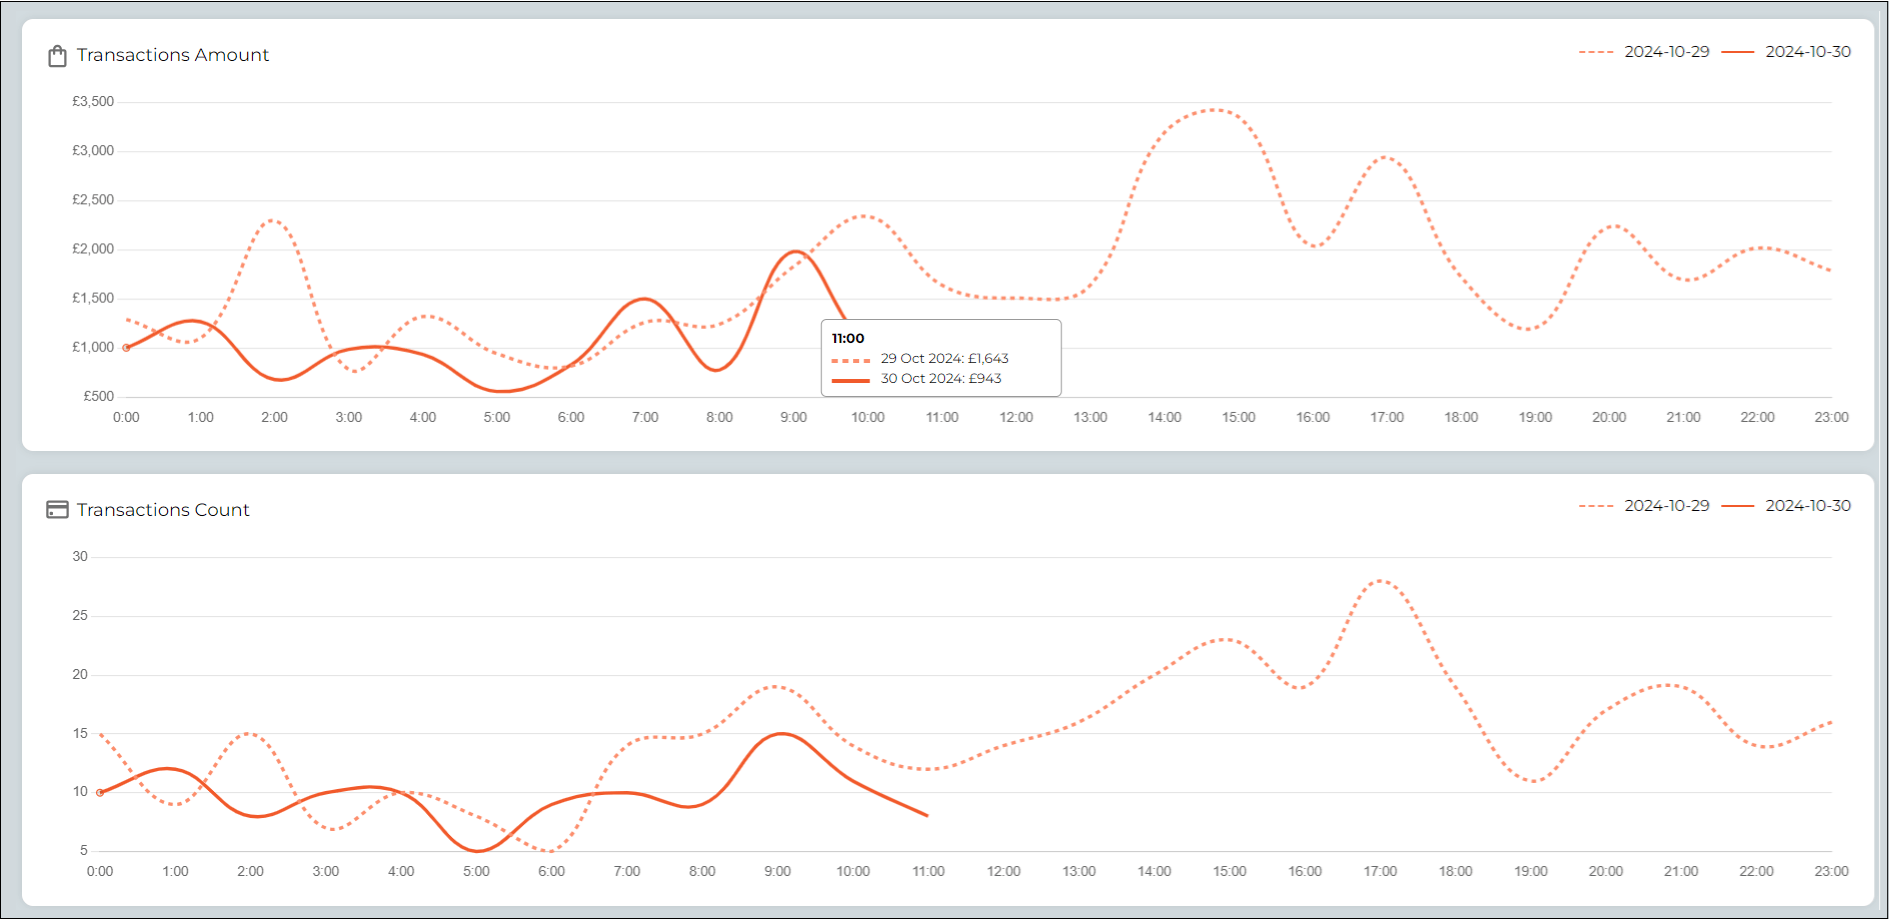
The following figure shows the transaction graph region: