
- Sales- functionality unique to Sales
- Funnel Analytics - functionality unique to Funnel Analytics

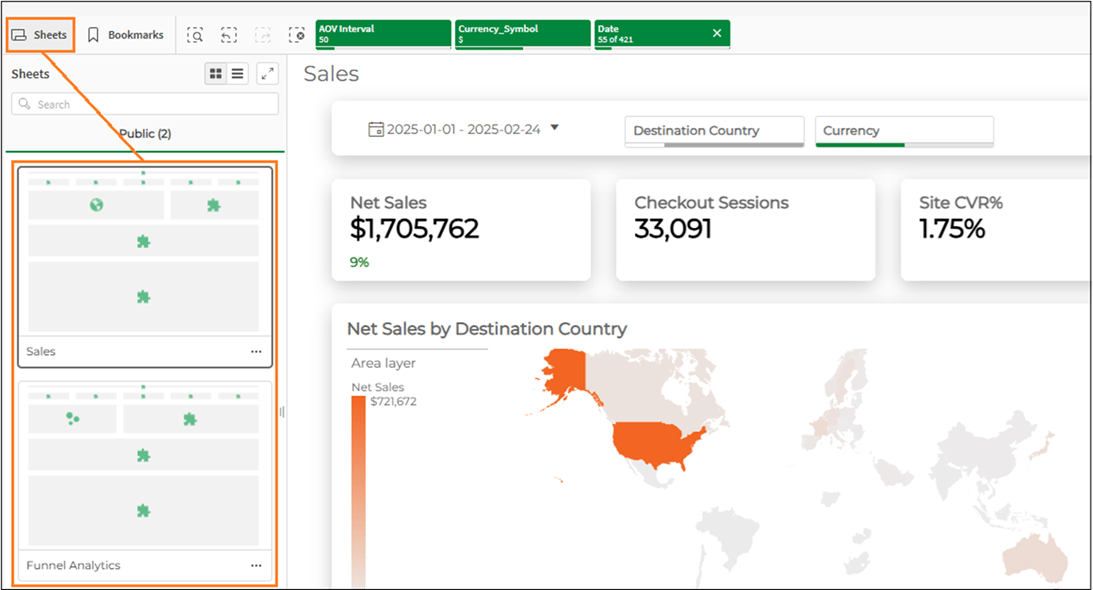
Sales
TheSales sheet displays sales-related metrics. The Sales sheet includes the following main areas, each discussed in greater detail in its own section:Business Metrics Panel
The following figure shows the Business Metrics Panel for Sales: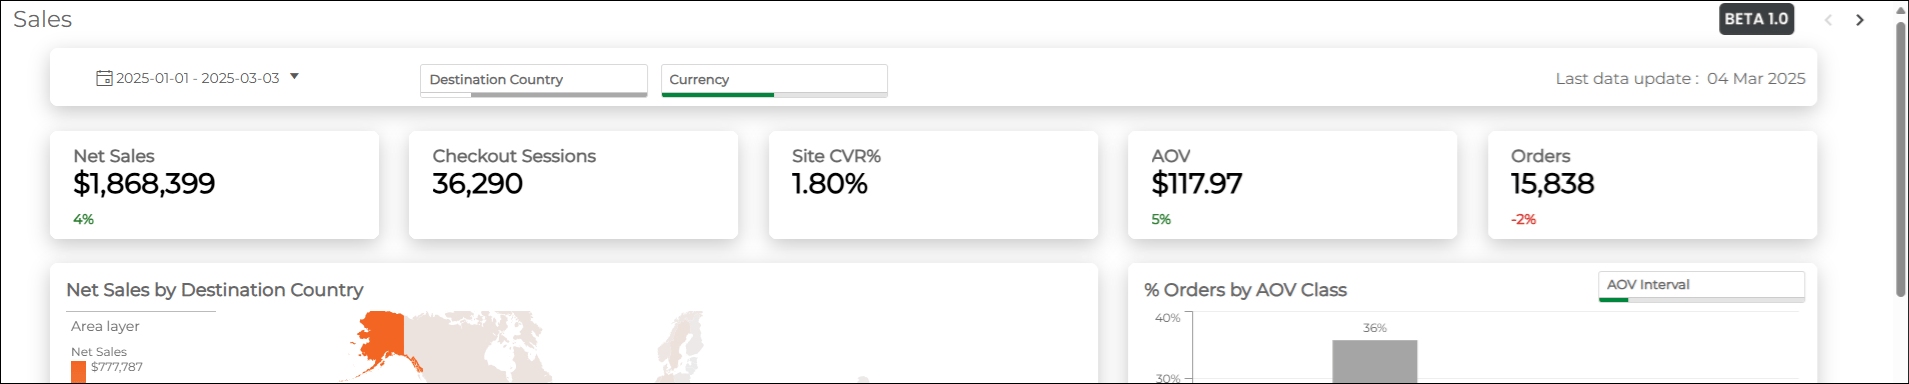
Net sales - Total products sales price excludes discounts. The % change of net sales value is located under Net sales. This value indicates the change in percentage of net sales between the previous and current period. Green text indicates positive change, while red indicates negative. Checkout sessions - Total number of Checkout sessions. Site CVR% (Conversion Rates) - Total transactions divided by browsing sessions. AOV (Average Order Value) - Net sales divided by number of approved orders. The % change of AOV value is located under AOV. This value indicates the change in AOV percentage between the previous and current period. Green text indicates positive change, while red indicates negative. Orders - Total number of approved orders. The % change orders value is located under Orders. This value indicates the change in percentage of orders between the previous and current period. Green text indicates positive change, while red indicates negative.
Net Sales by Destination Country
The Net Sales by Destination Country is a scrollable, zoomable map. The following figure shows the Net Sales by Destination Country: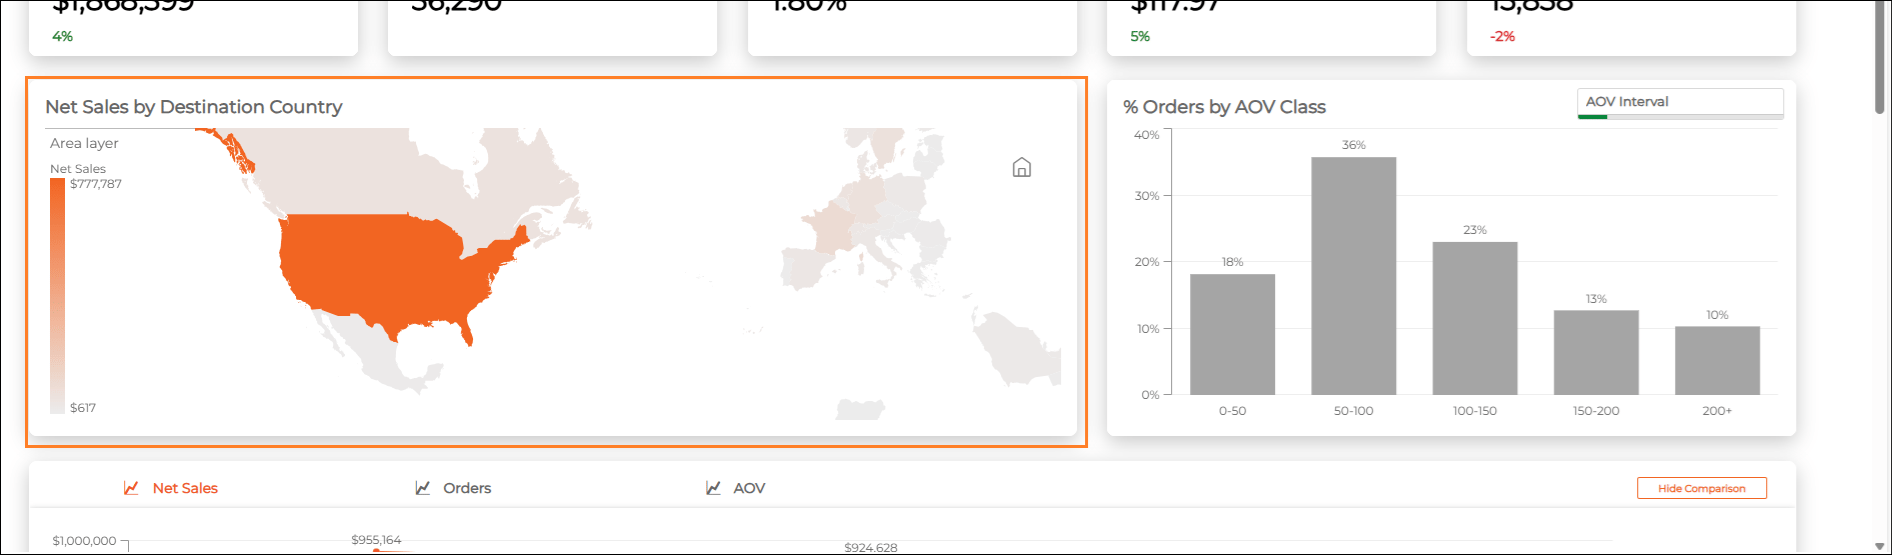
Percentage of Orders by AOV Class
The Orders by AOV Class is a histogram that shows the percentage of orders according to **Average Order Value (AOV)**class. You can change the AOV interval by selecting the AOV interval filter within the chart area. The following figure shows the Orders by AOV Class graph: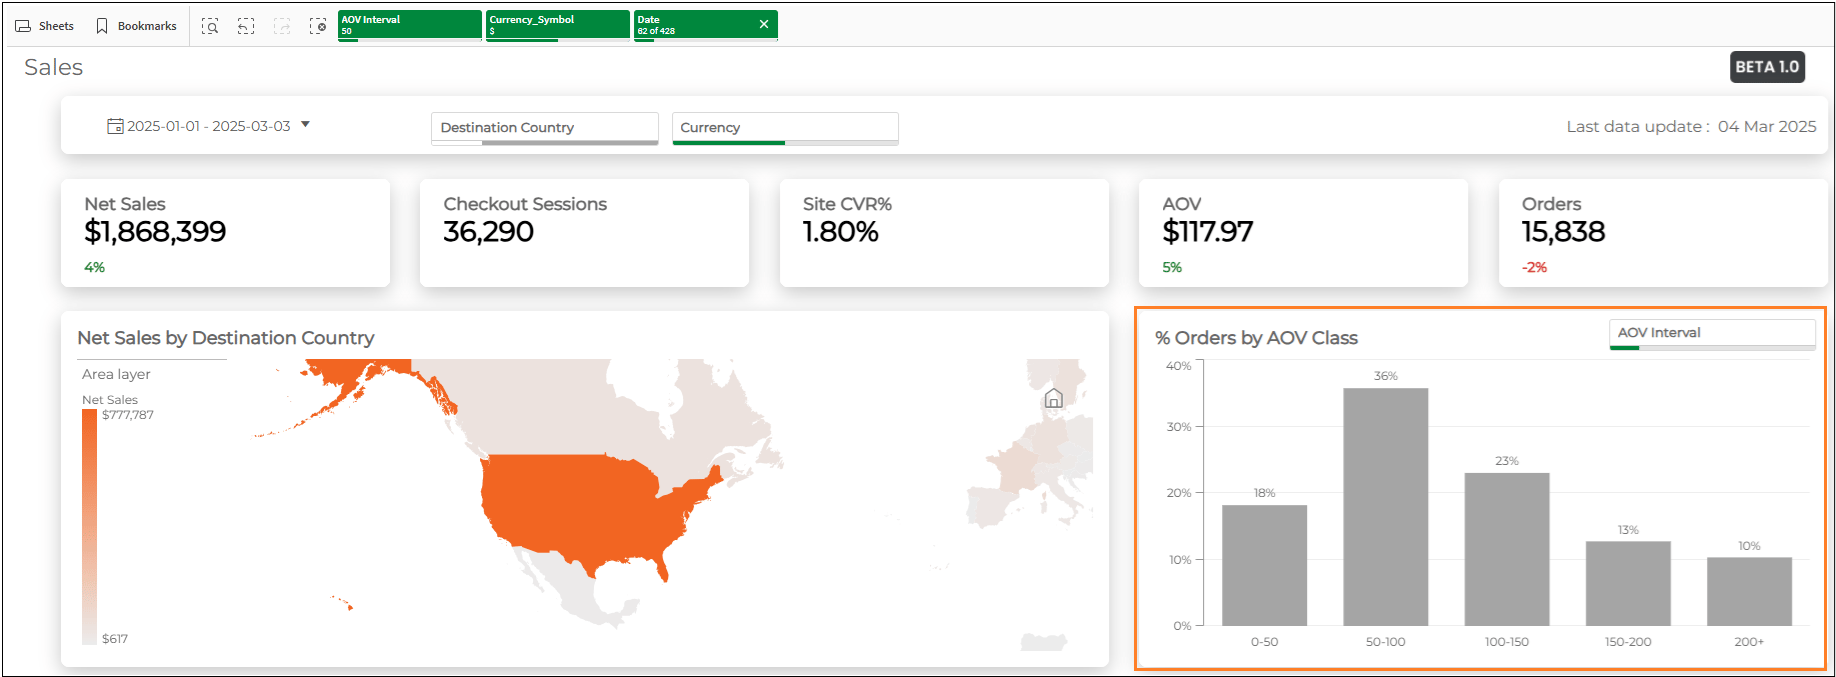
Historical Trend Graph
The Historical Trend Graph shows the trend of net sales, orders, or AOV for the current period. You can change the resolution, set to Monthly by default, from the menu located at the bottom of the graph. You can also switch the measure between these three by clicking one of the toggles located at the top of the graph. In addition, you can show or hide the previous year comparison by clicking Hide/Show Comparison in the top right corner of the graph. Regardless, hovering over a data point shows the period and the amount. The following figure shows the Historical Trend Graph: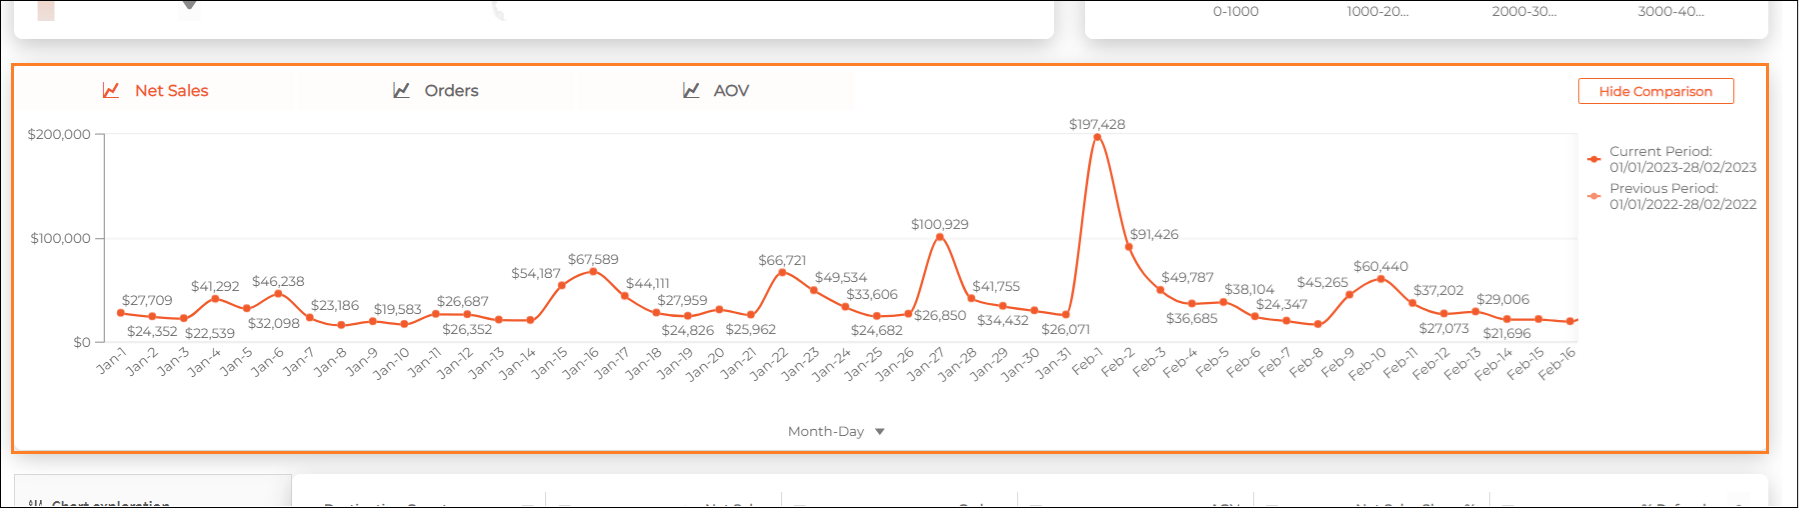
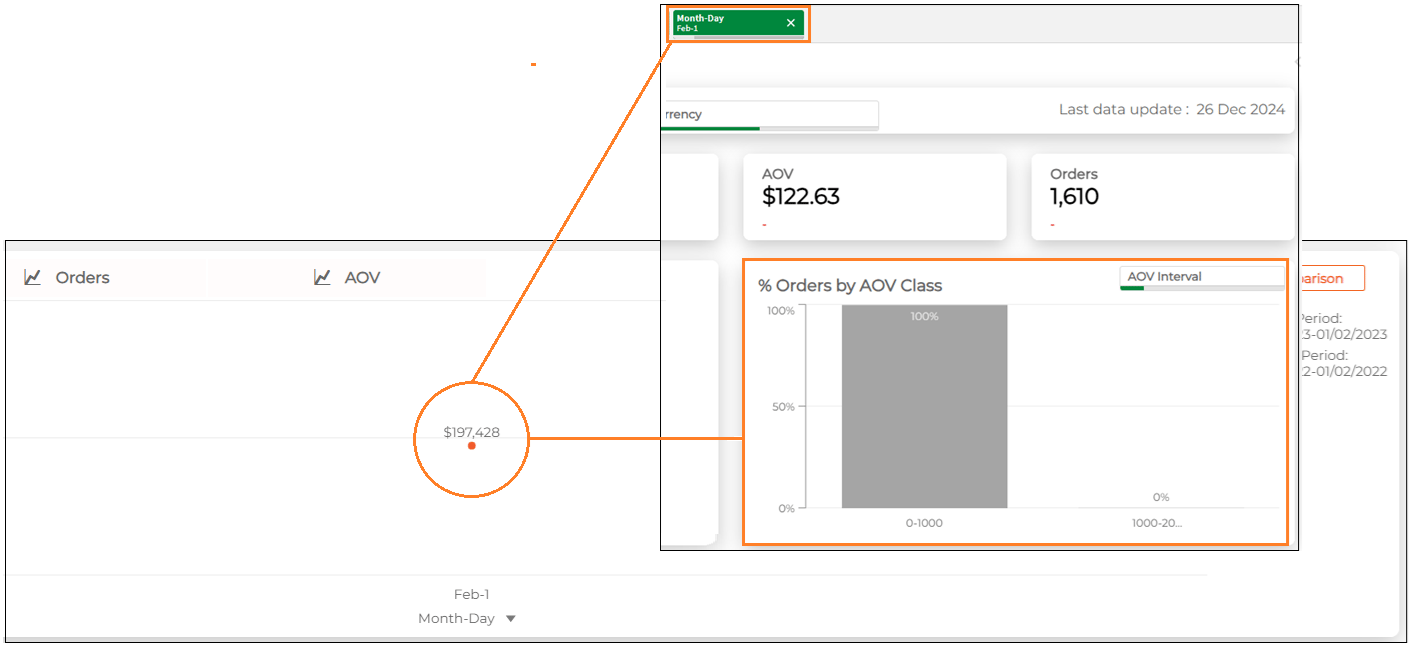
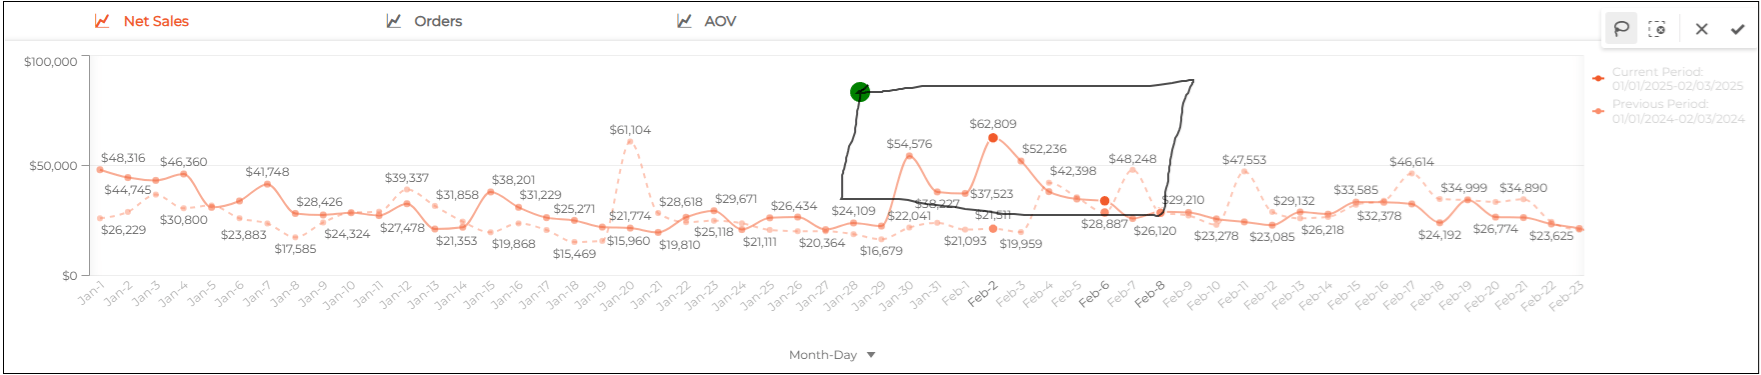
Once you’ve selected a number of points with the lasso option, separately adding more points adds their sum to the current selection, and does not replace it with the newly selected points. To cancel your current selection and start over, click the Cancel Selection button in the top right corner with the other features.
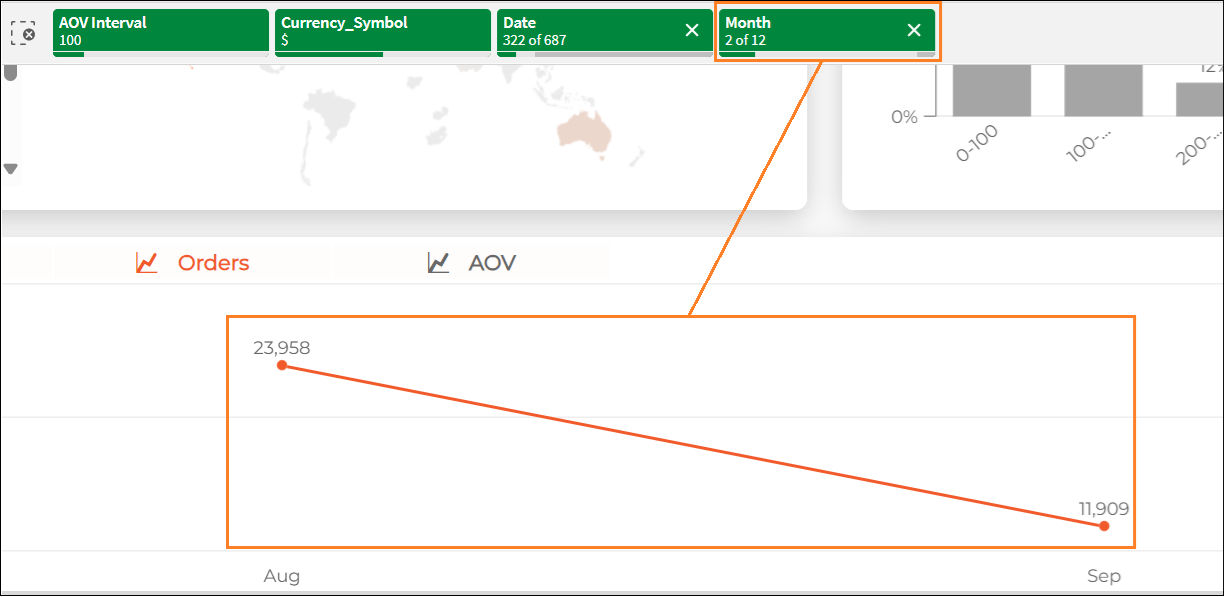
Chart Exploration Table - Net Sales
The Chart Exploration Table for Sales displays all sales business metrics broken down according to country: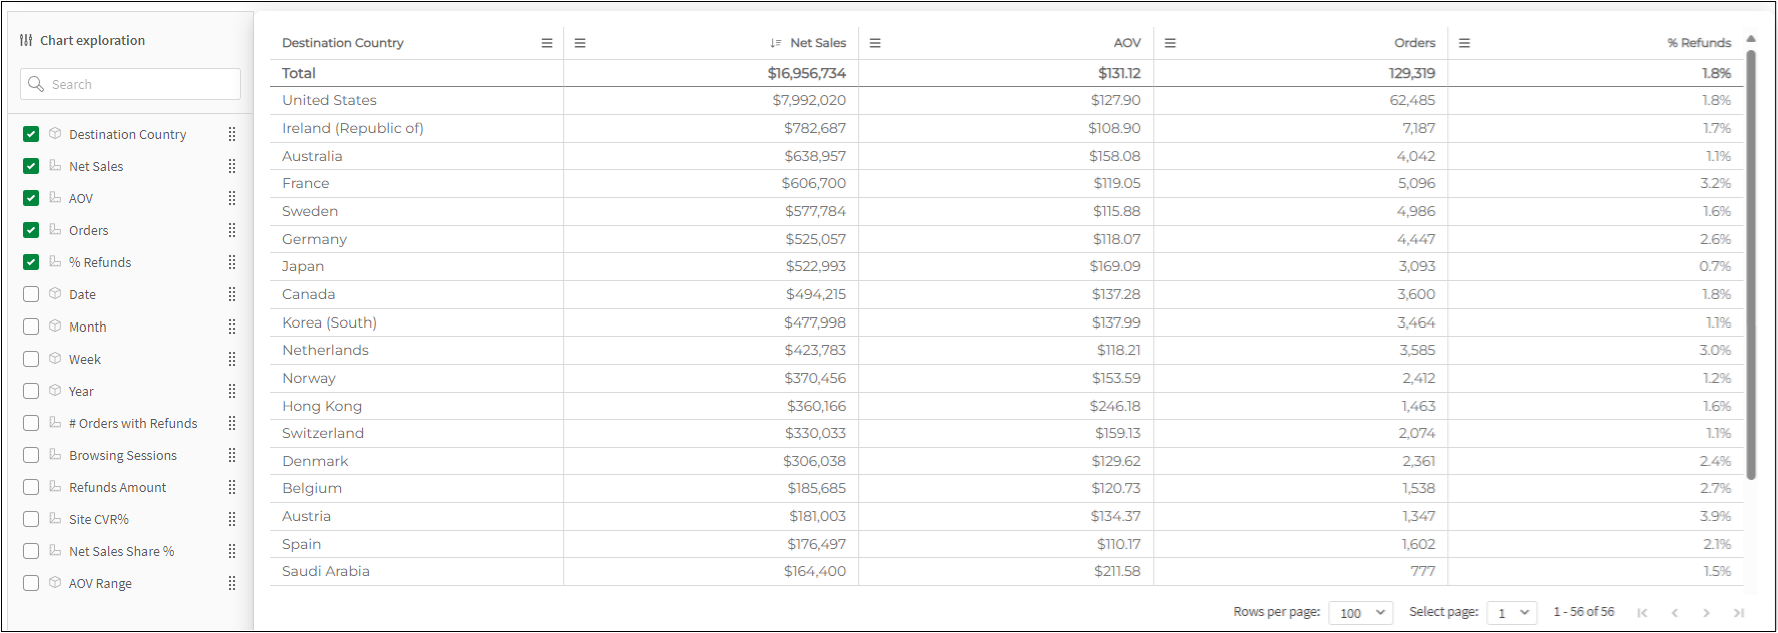
Funnel Analytics
The Funnel Analytics sheet includes the following main areas, each discussed in greater detail in its own section:Business Metrics Panel
The following figure shows the Business Metrics Panel for Funnel Analytics:
- Site CVR - Total transactions divided by browsing sessions
- Browsing to Checkout CVR - Total checkout sessions divided by browsing sessions
- Checkout CVR% - Total checkout transactions divided by checkout sessions
- Browsing Sessions - Total number of Browsing Sessions
- Checkout Sessions - Total number of Checkout Start events
The full data set is available only to merchants that provide site event collection. For more information, contact your CSM.
Top Ten Destination Countries by Net Sales
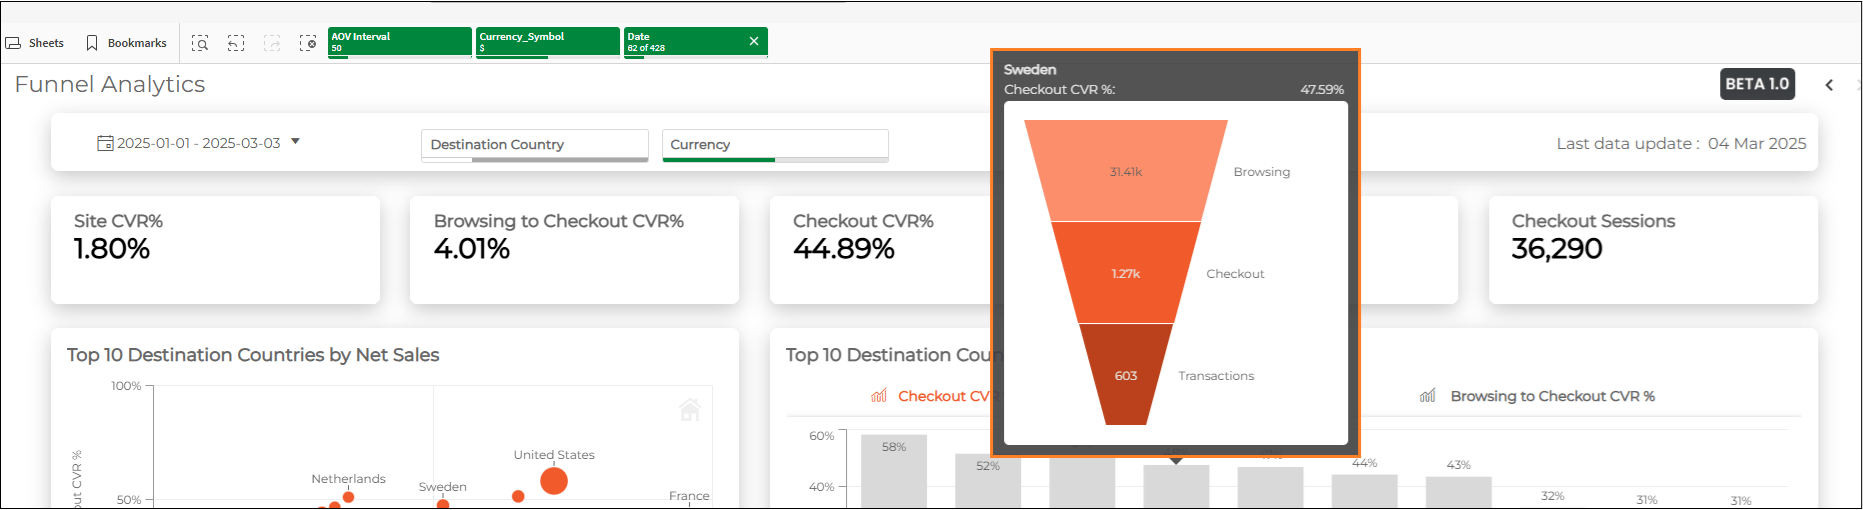
The Top 10 Destination Countries by Net Sales bubble chart is a graph that shows the relationship between the browsing to checkout CVR percentage and the checkout CVR percentage for the top ten destination countries according to their net sales. The following figure shows the Top Ten Destination Countries by Net Sales: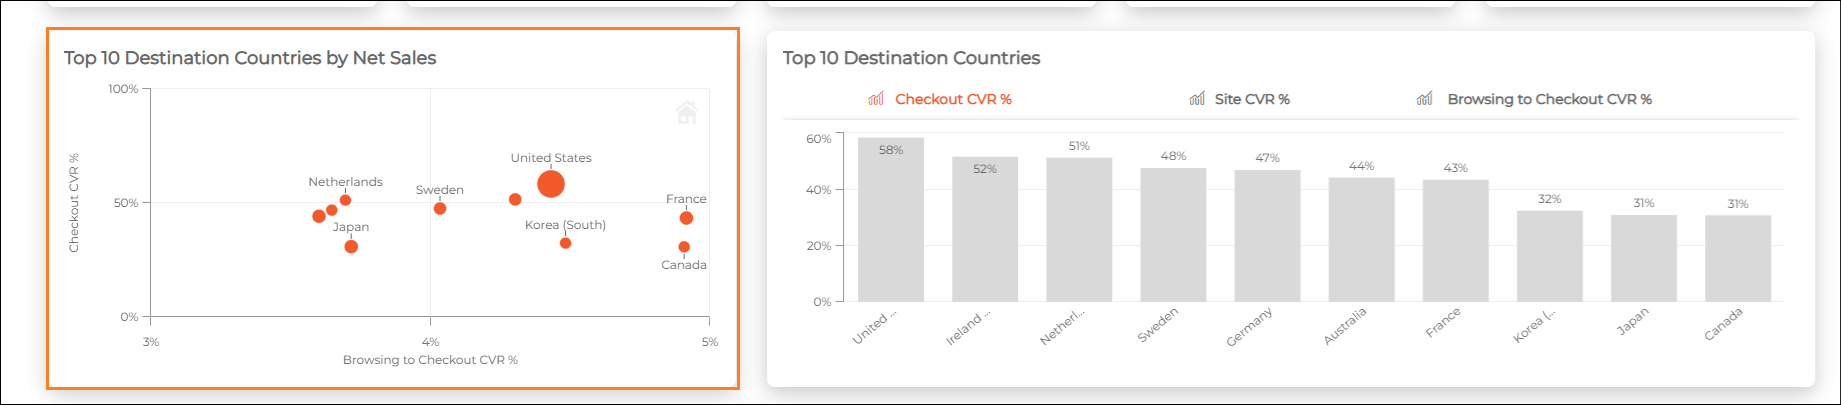
Top Ten Destination Countries Graph
The Top Ten Destination Countries is a graph that shows all three CVR metrics for the top ten destination countries sorted by the selected metric. These graphs let you compare the top ten markets according to Checkout CVR percentage, Site CVR percentage, and Browsing to Checkout CVR percentage. You can toggle between these metrics by selecting one from the top row of the graph: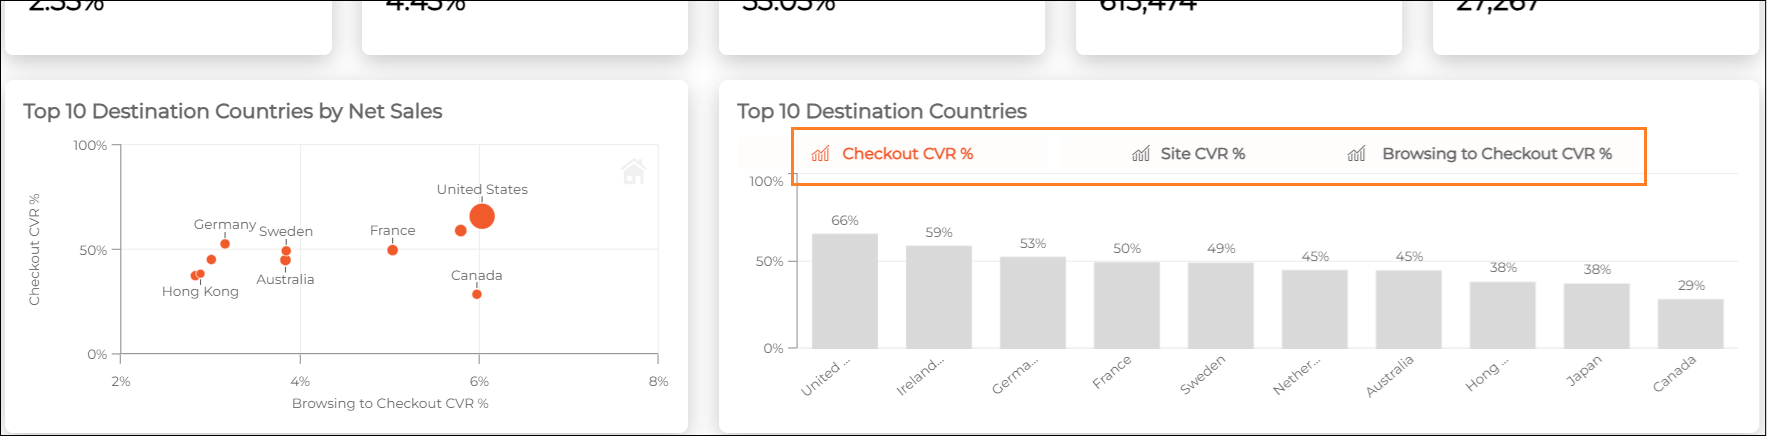
Conversion Trend Graph
The Conversion Trend Graph shows the trend of checkout CVR percentage, site CVR percentage, or browsing to checkout CVR percentage for the selected period. You can change the resolution, set to Monthly by default, from the menu located at the bottom of the graph. You can also switch the measure between these three by clicking one of the toggles located at the top of the graph.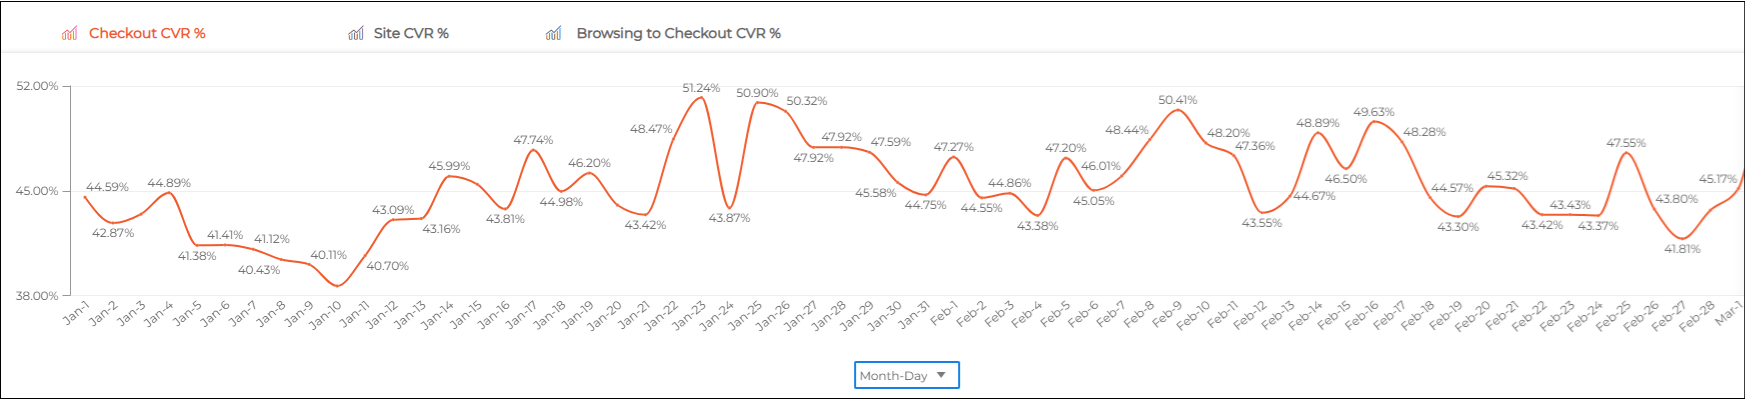
Chart Exploration Table - Conversions
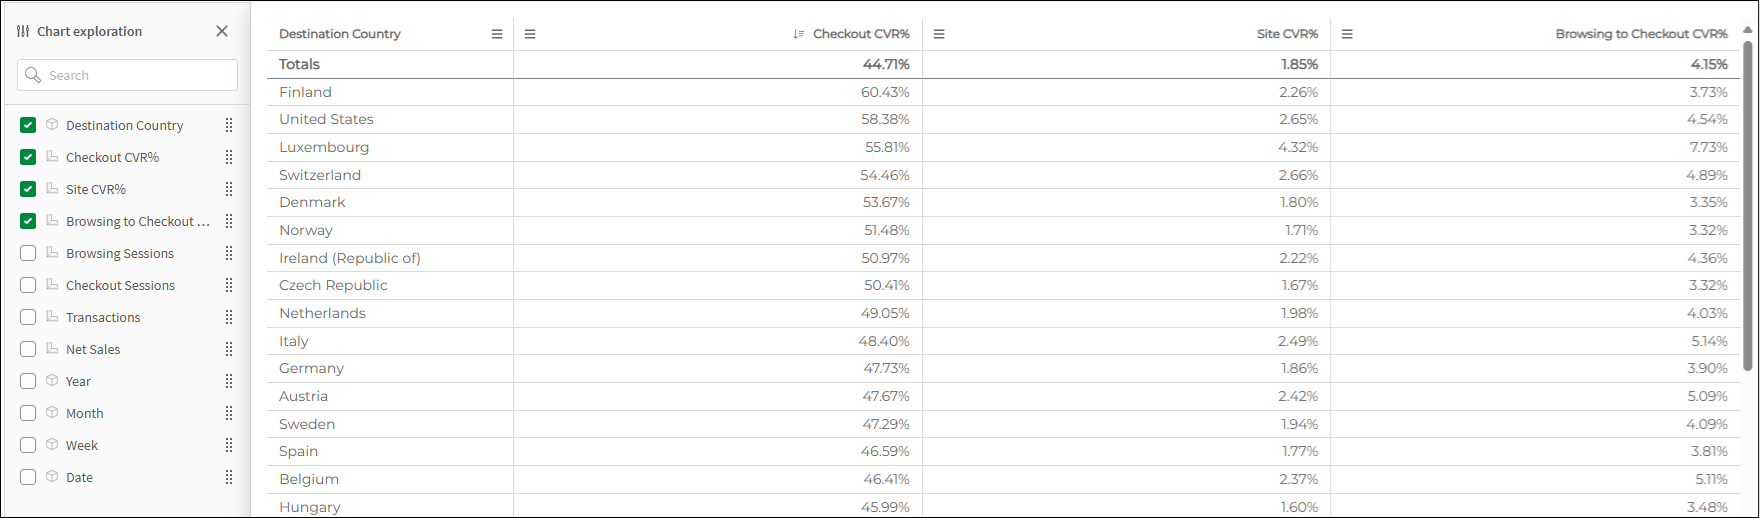
The Chart Exploration Table for Funnel Analytics displays all Funnel business metrics broken down by country: