

- Return activity and performance
- Order-level return trends
- Customer interactions in the Return Portal
- Financial transactions related to returns
- Customer gift cards, and discount codes
Accessing Analytics
- Navigate to Analyticsfrom the left menu.
-
Select one of the following:
- Returns
- Orders
- Sessions
- Transactions
- Credits
Returns Analytics
The Returns page shows return activity during the selected timeframe.Accessing Returns Analytics
- Navigate to Analytics > Returns from the left menu.
- Select one of the following:
Monitoring and Analyzing RMA Status
The RMA Statustab provides a centralized analytics dashboard for monitoring and analyzing returns activity. It presents high-level KPIs such as the number and value of RMAs, returned items, time and logistics cost savings, and Portal NPS, alongside visualizations that track trends over time and distributions by policy rules and return methods. Together, these insights enable merchants to understand returns volume, financial impact, operational efficiency, and customer experience at a glance, even clearly indicating when no data is available to ensure transparency and consistency in reporting.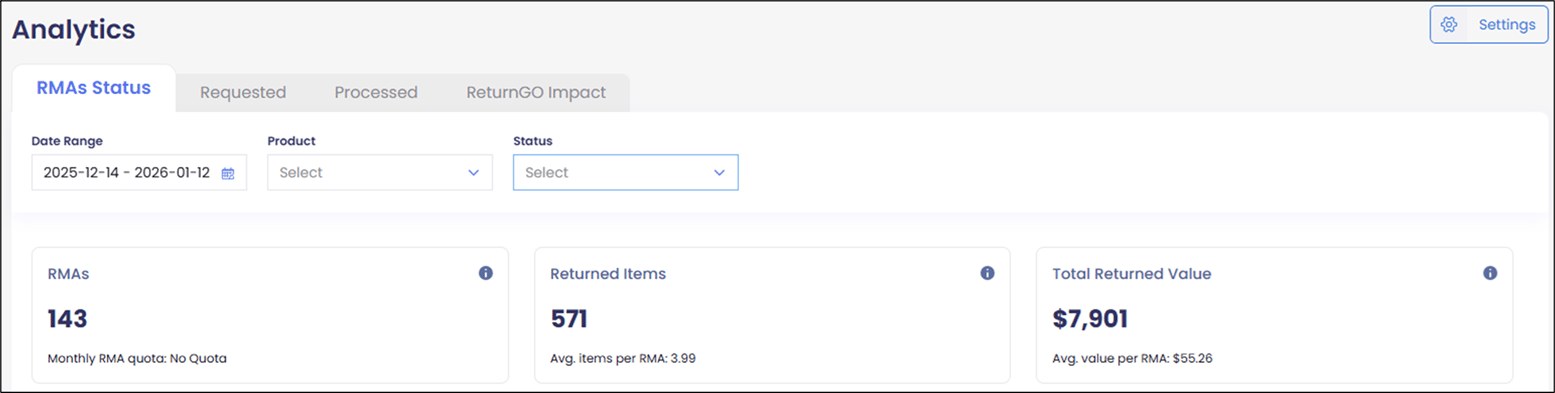
- Select RMA Status.
- Select a date range from the Date Range calendar.The displayed data refreshes daily.
- Select a product from the Productmenu.
- Select a status from the Statusmenu.
Analyzing Requested Returns
The Requestedtab provides detailed insights into retained revenue and return behavior, with flexible filtering by date range, product, return reason, and status. It highlights the total revenue retained from non-refunded items, along with the number of items retained, giving a clear view of value preserved through returns management decisions. Complementary breakdowns show the top return reasons and most-returned products by refunded item count, enabling merchants to quickly identify recurring issues, product-specific trends, and opportunities to optimize sizing, fulfillment, or policy strategies.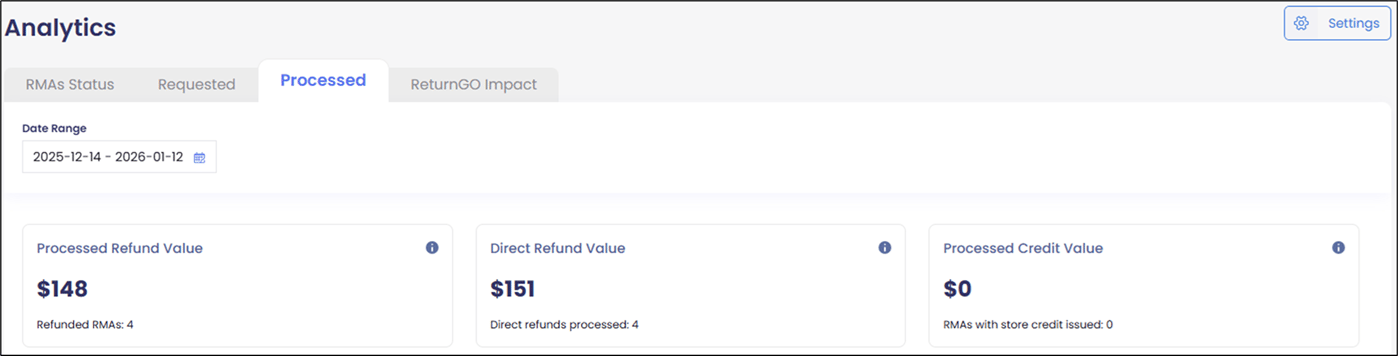
- Select Requested tab.
- Select a date range from the Date Range calendar.The displayed data refreshes daily with information up to the previous day.
- Select a product from the Productmenu.
- Select a status from the Statusmenu.
-
Select one of the following resolutions:
- All
- Refund
- Exchange
- Gift Card
- Store Credit
Analyzing Processed Returns
The Processed tab provides a comprehensive view of how returns are resolved and their financial outcomes. It summarizes the total value and volume of processed refunds. Visualizations further break down processed resolutions by type and track resolution activity over time, enabling merchants to understand customer resolution preferences, measure the refund strategies, and assess the overall revenue impact of returns processing.- Select Processed tab.
- Select a date range from the Date Range calendar.The displayed data refreshes daily with information up to the previous day.
Downloading Return Data
Some graphs and data displayed can be downloaded to CSV for further analysis by clicking the download: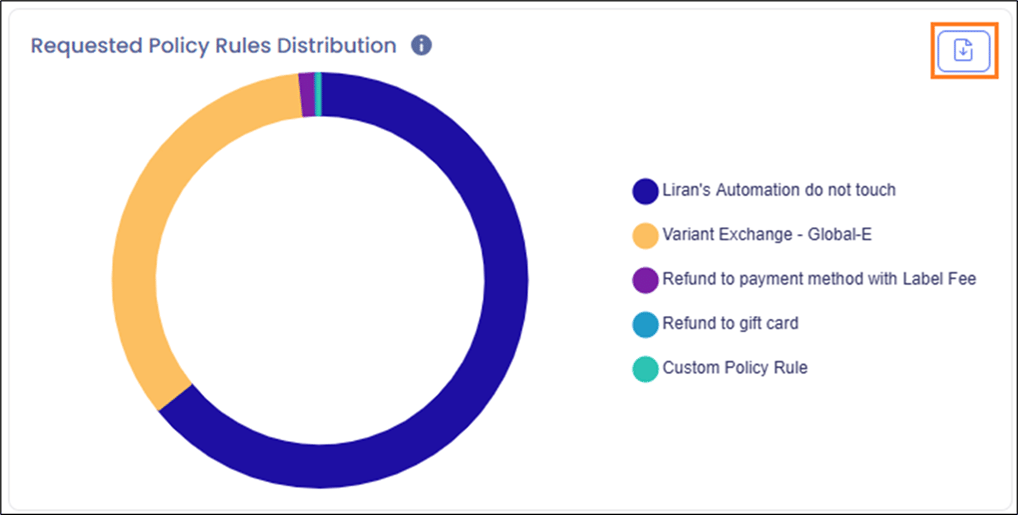
Order Analytics
The Orders page shows return data based on orders placed during the selected timeframe. Order Analytics applies to Shopify stores only. From here you can view and analyze:- The amount and average of ordered items
- The amount and average of returned items
- The return rate
- The total number of ordered items
- Return rate trend chart
- The resolution distribution
- Number of orders and returns
- The dollar amount corresponding to the orders and returns
Accessing Order Analytics
- Navigate to Analytics > Orders from the left menu.
- Select a date range from the Date Range calendar.The displayed data refreshes daily with information up to the previous day.
- Select a product from the Productmenu.
- Select an order type from the Order Type menu.
Downloading Order Data
Some graphs and data displayed can be downloaded to CSV for further analysis by clicking the download button: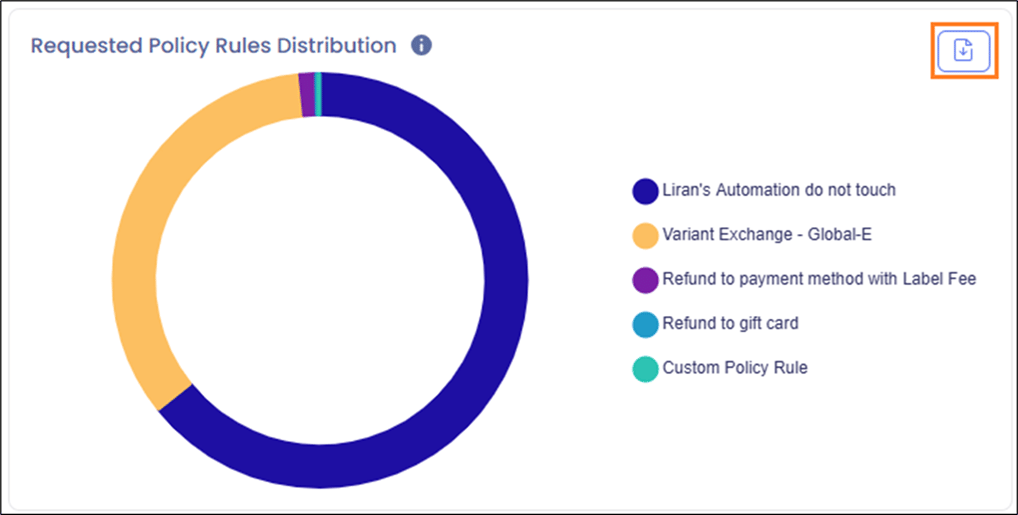
Sessions Analytics
The Sessions page shows customer interactions in the Return Portal:Accessing Session Analytics
- Navigate to Analytics > Sessions from the left menu.
-
A table showing the following information is displayed:
- ID
- Date/Time (UTC)
- Customer ID
- Order ID
- Status
- Values
- Action
-
Optional- Search by Customer ID, Order ID, or Status:
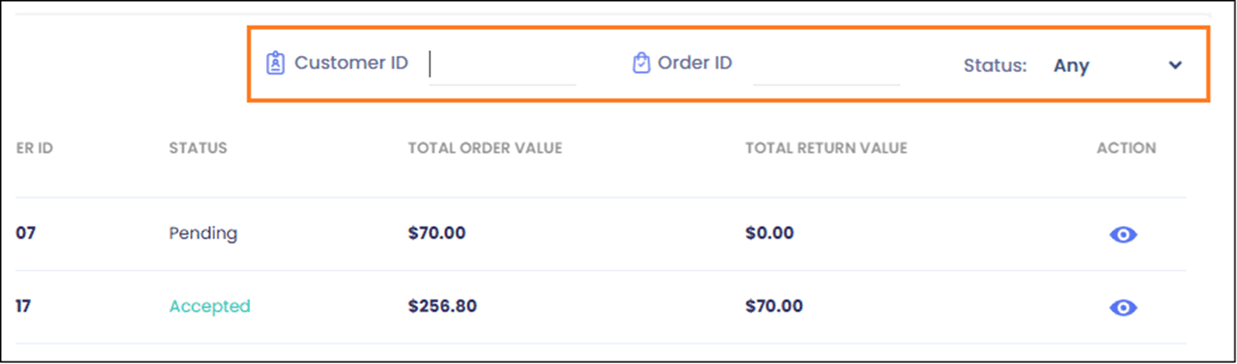
- In the row corresponding to the ID you want to analyze, click the Actionicon.
-
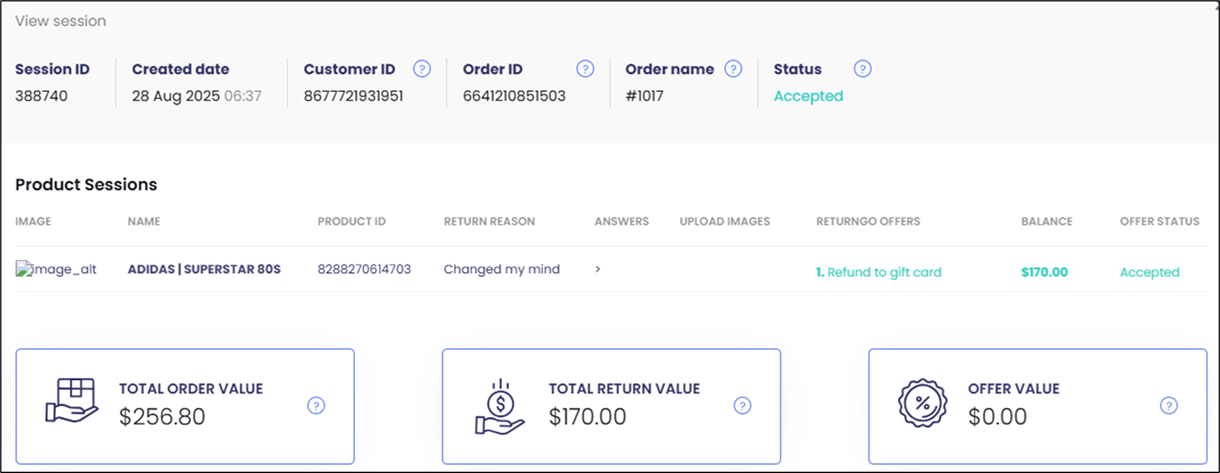
The session details are displayed:
Credits Analytics
The Creditspage shows customer discount codes, and gift cards: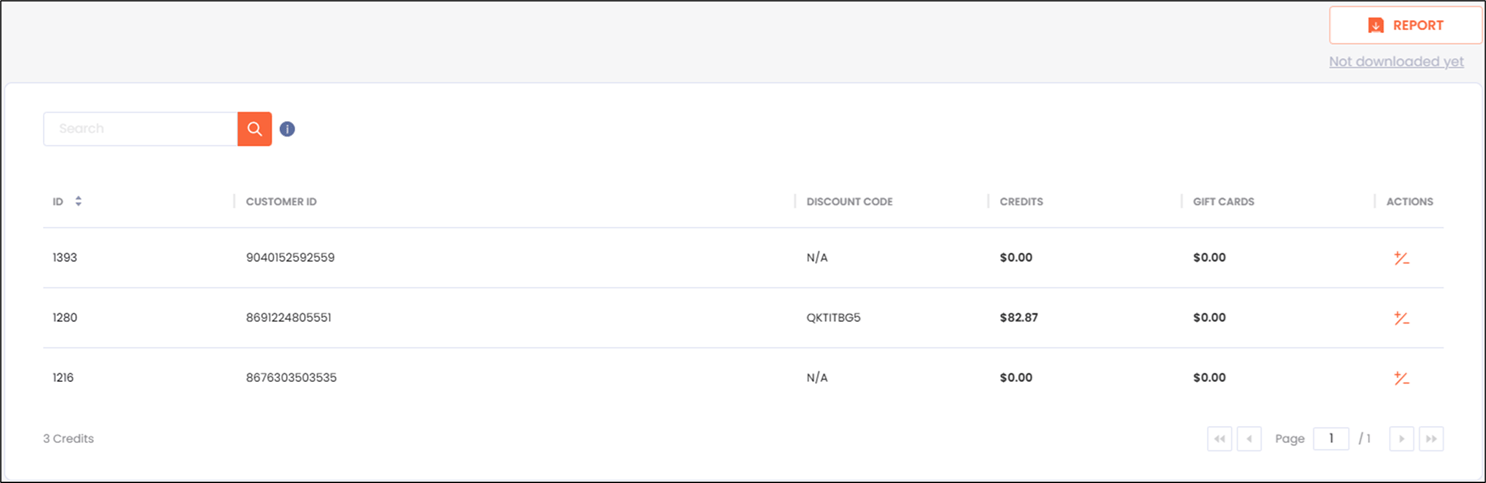
Accessing Credits
- Navigate to Analytics > Credits from the left menu.
-
A table showing the following information is displayed:
- ID
- Customer ID
- Discount Code
- Credits
- Gift Card
- Actions
- Optional - Search by Customer ID.
Transactions Analytics
The Transactionspage shows financial activity processed through the Return Portal: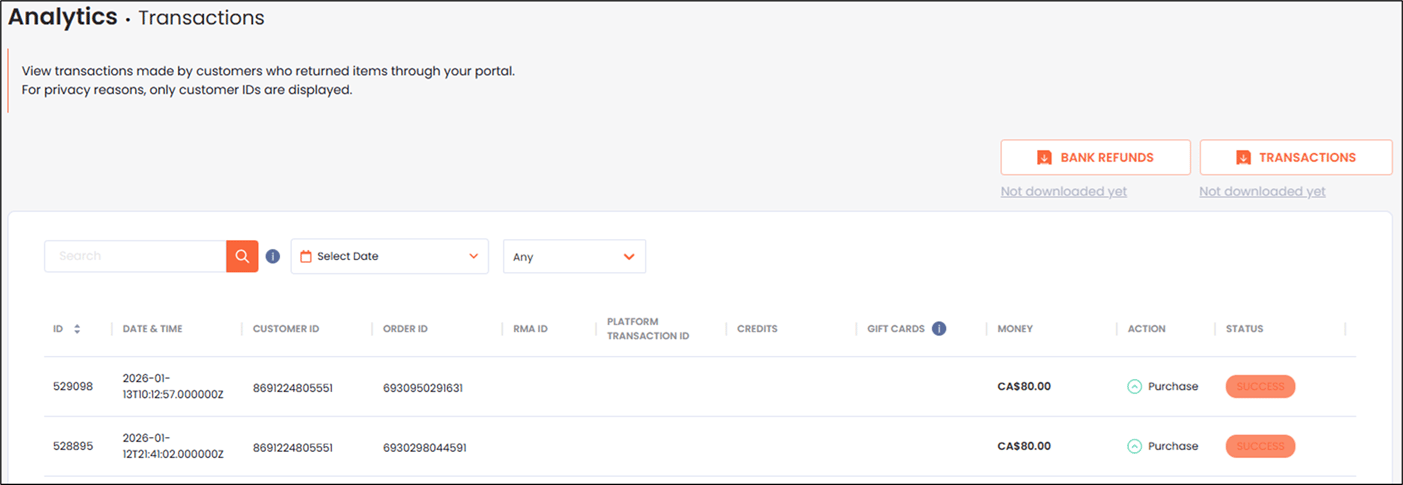
Accessing Transactions
- Navigate to Analytics > Returns from the left menu.
- Select a date range from the Date Rangecalendar.The displayed data refreshes daily with information up to the previous day.
-
Select one of the following statuses:
- Any
- Purchase
- Refund
- ID
- Date & Time
- Customer ID
- Order ID
- RMA ID
- Platform Transaction ID
- Gift Cards, Money
- Action (Refund, Invoice, Purchase, Authorization, Capture)
- Status (Requested, Success, Canceled)
Downloading Transaction Reports
- Follow steps 1-3 inAccessing Transactions.
-
Click one of the following:
- Bank Refunds
- Transactions
Certain fields may appear blank depending on refund type or store configuration.